Performing a Single Sample T-test with Stata
The single sample t-test is quite a bit like a Z-test (wherein a test value is compared to the population) except less information about the population is known. Instead this information is estimated from the sample. With this estimation, the sample mean can once more be compared to the population mean. The null hypothesis is that there is no difference between the sample and the population.
A single sample t-test with Stata requires a test value (often either zero or the scalar midpoint) and a discrete continuous, normally distributed variable.
From there, simply type ttest variablename==testvalue where the variablename is the name of the variable you want to test and the testvalue is the value against which you are testing. Note the double equal sign, which is required for the test to work.
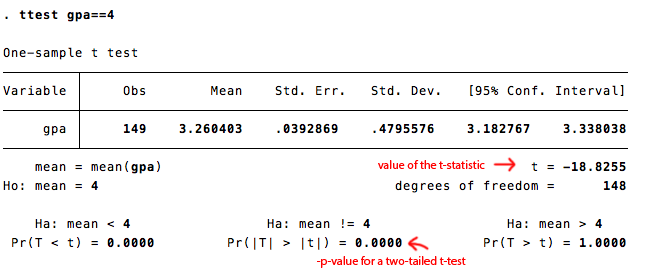
In this example, we want to test if a made-up sample's set of GPAs are significantly different from a perfect GPA of 4.0. We run the analysis with Stata and get the following output:

In this case, the test reveals a significant difference. All of the information for the APA writeup is available in the STATA output above:
A single-sample t-test revealed that participants' GPAs (M=3.26, SD=0.48) were significantly lower than a perfect GPA of 4.0, t(148)=-18.83, p < 0.001.
Back