Correlation in Stata
Correlation is performed using the correlate command. If no variables are specified (e.g., correlate var1 var2 var3 versus just correlate), Stata will display a correlation matrix for all nonstring variables:
If instead you specify variables after correlate , only those variables will be displayed.
For more information about your variables, Stata offers options such as means , or covariance. means displays mean, standard deviations, mins and maxes for each variable contained in the matrix.
covariance (which can be shortened to co ) displays the covariances rather than the correlations.
In addition to correlate, Stata offers pwcorr which displays pairwise correlation coefficients...

...and like correlate it can be run either on the entire data set or on the user-specified variables. This example comes from a made-up dataset.

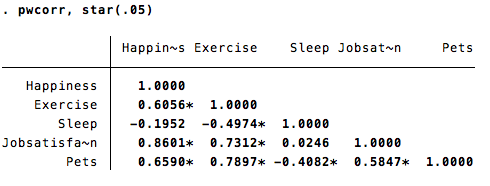
pwcorr offers the option print(p-value) which has the matrix only display values with a significance at or better than the one specified (e.g.,print(.05)). In addition, the option star(p-value) will put the * character next to correlates at or better than the specified value:

If your correlation matrix is on the large side, you might consider adding the bonferroni or sidak option, which will correct your p-values accordingly. The print, star and correction options can be used together (for example pwcorr, print(.05) star(.01) bonferonni would display a pairwise correlation matrix that would only print correlations at p=.05 or better, would star correlations at p=.01 or better, and would use bonferroni adjusted p-values to make those printing and starring decisions.)
pwcorr has a few additional options as well, which can be seen by typing help pwcorr into the Command window.
If your data are nonnormal you may want to use a Spearman correlation instead. The command spearman takes nearly all the same options as pwcorr (sidak bonferroni print star). Additionally, you can use the option pw to do pairwise Spearman correlations. Stata also offers a Kendall tau command for nonparametric data correlations. A concise explanation of the difference between the two can be found here though it is probably not enough information if you are not already fairly comfortable with the subject matter. The command for running a Kendall tau is ktau and takes the same options as spearman
If you prefer to use the menus, regular (Pearson) correlations as well as pairwise and partial are found in Statistics => Summaries, tables, and tests => Summary and descriptive statistics => Correlations and covariances. The Spearman and Kendall-tau correlations are located in Statisticss => Summaries, tables, and tests => Nonparametric tests of hypotheses.
Back