Understanding Code
R is a language
And you should think of learning it just like you would a language, like French, for example. Don't expect yourself to understand everything right away. And just like you'd consult a dictionary, you can search online for example code or explanations.
In the beginning, you would start simply and just try to change a sentence like "the dog ran" to "the cat ran" or "the dog walked". This entails identifying which words are nouns and which are verbs and knowing what you can swap out to change the meaning of the sentence.
In R, we have these same parts of speech and when you start learning, you'll want to be able to identify what you should swap so that you can take code you find or are given and adapt it to your data.
Variables are similar to nouns. In R, we define our variables, meaning we can name them whatever we want. Often, variables will be the name of our dataset, the names of columns within our dataset, or other things we decide we want to create and store so we can use them by name. We can define variables by using <-, which is the symbol to assign everything on the right to the name on the left. When you first start out coding, you will usually be swapping out example variables for the names of the variables in your data.
Functions are similar to verbs. Functions will always include parentheses () after the function name. While variables can be named whatever we want, functions all have defined names that correspond to what they do. Over time your vocabulary will grow, but the great thing about coding is you don't really need to memorize all the functions you want to use—you'll always be able to look things up (with the possible exception of taking a test in a CS class). R also has a built in dictionary that will tell you everything about what a function does.
Click the colored words to see the nouns and verbs in the code below:
Click to highlight the functions.
y <- c(1, 3, 5)
z <- x* y
mean( z)
Click on elements in the following code to test yourself to see if you can identify which elements are variables, which are functions, and which are neither of those two. Just like in a spoken language, code also has elements that serve as adjectives or adverbs. You'll pick those up along the way, for now concentrate on identifying the basic building blocks.
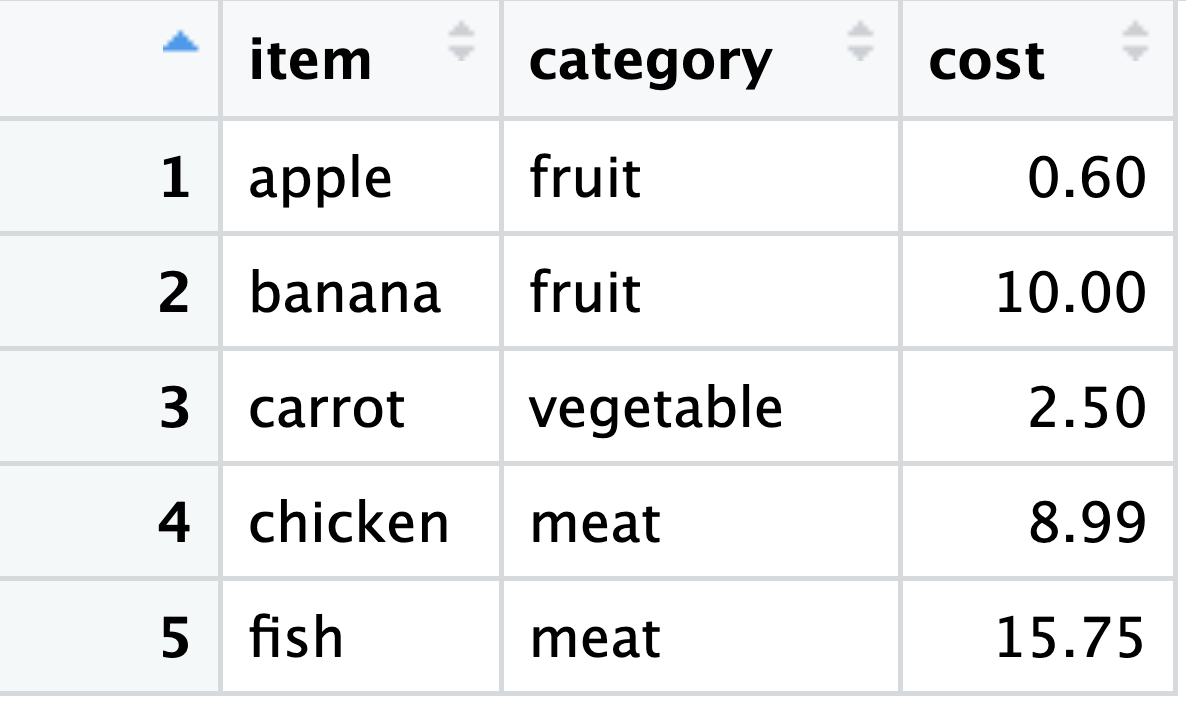
item = c("apple", "banana", "carrot", "chicken", "fish"),
category = c("fruit", "fruit", "vegetable", "meat", "meat"),
cost = c(.60, 10.00, 2.50, 8.99, 15.75)
)
print(groceries)
grocery_summary <- groceries |>
mutate(percent_total = cost / sum(cost) * 100)
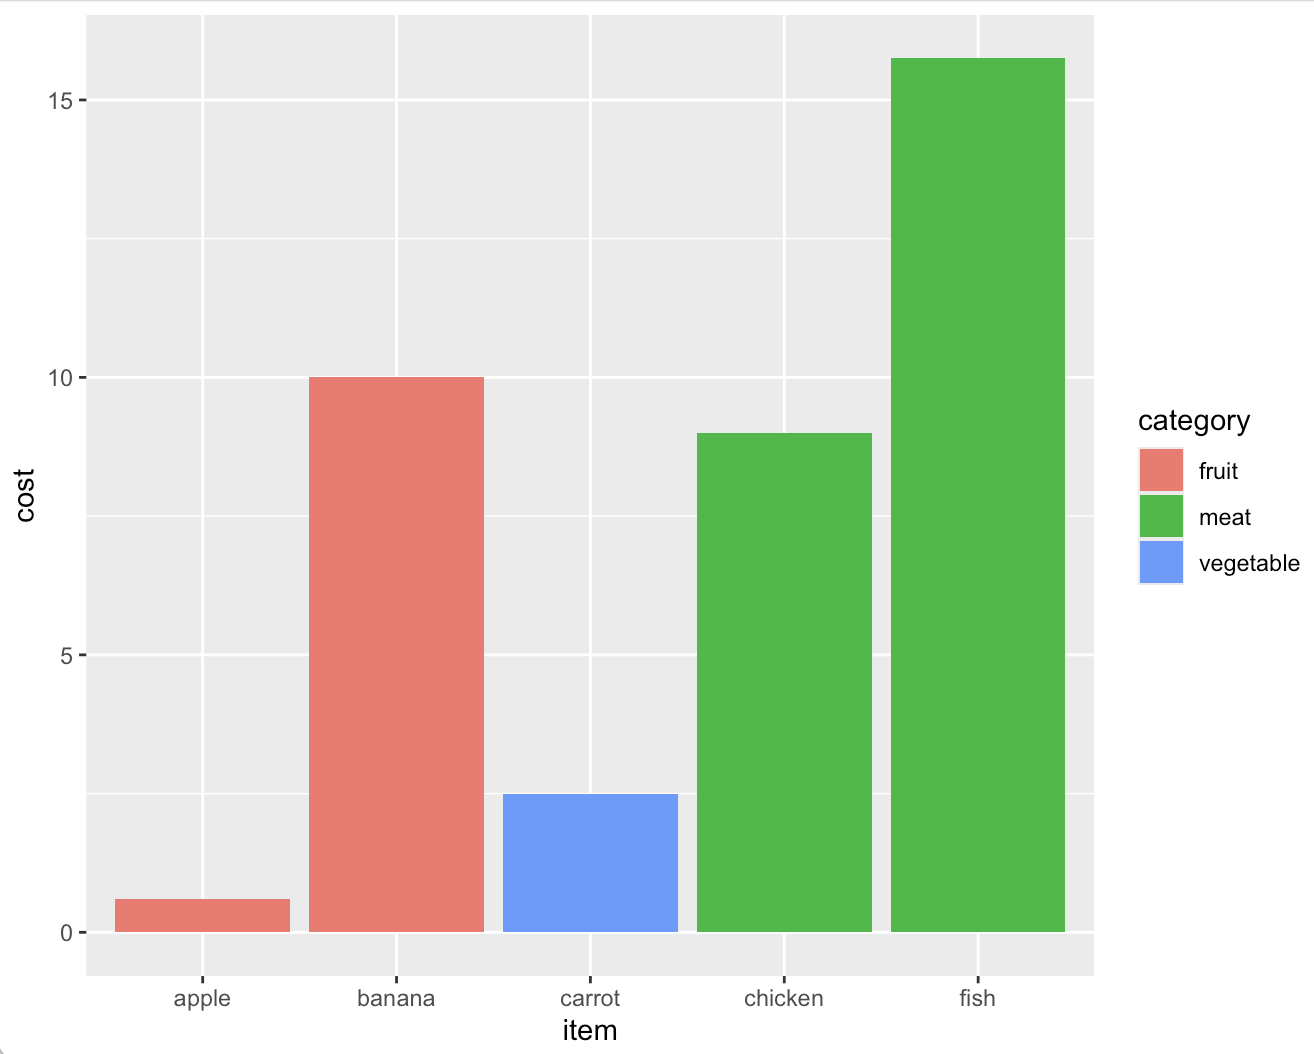
ggplot(groceries, aes(x = item, y = cost, fill = category)) +
geom_bar(stat = "identity")
Now let's look at what each line of that code does.
item = c("apple", "banana", "carrot", "chicken", "fish"),
category = c("fruit", "fruit", "vegetable", "meat", "meat"),
cost = c(.60, 10.00, 2.50, 8.99, 15.75)
)
mutate(percent_total = cost / sum(cost) * 100)
geom_bar(stat = "identity")
Below is what you would see in RStudio when you run the code. The table on the left is the groceries variable and the graph on the right is that information presented as a bar chart.
To continue learning the basics of R, either of the pages below are good next steps.
Link to a series of short videos that demonstrate coding and help you learn the syntax and more: Intro R Videos
A workshop where you can interactively type code and run it to simulate how things would work in RStudio: Intro R Workshop