QGIS Intro
Understanding GIS Files
GIS data is more complicated than just loading in a single spreadsheet. You will only need to load specific files but those files will use other files behind the scenes, so all files must be kept in the same folder. The following are the most typical types of files included.
For vector data:
- .shp: the shapefile that shows the geometry for the map (shapes that will be displayed)
- .shx: the shape index position (tells where on the map the shape goes)
- .dpf: the attribute data (typical spreadsheet type data)
- .prj: the projection system (what type of map coordinates)
- .gdb: geodatabase is a collection of files in a folder on disk that can store, query, and manage both spatial and nonspatial data
For raster data:
- .tif: the image to be displayed
- .tfw: coordinates for the image
- .vat: attribute data for raster
Optional
- .qpj: the QGIS specific projection
- .cpg: additional data for the .shp file
Your main takeaway from this just needs to be that all these files need to stay together. You don’t need to memorize what each type of file does. But all are necessary for the map to load, so always keep downloaded folders of data intact and don’t move or delete files even if you never directly open them.
Loading Files into QGIS
In this example, you will learn how to load data related to vegetation in Portland. All the files are found publically on Oregon GeoHUB. You will need to download the data contained in this zip file. Once the file is on you computer, double click it to unzip it. As said above, you don't really need to do anything else with these files except make sure they stay in the same folder and that you know where that folder is. Best practice would be to make a folder called something like "QGIS Practice" and move the unzipped folder into that folder.
Important things to note:
- It is a good idea to save your map project frequently.
- If a window seems to disappear, look behind your main window (sometimes windows shuffle to the back).
- If the program is not responding in a way you expect, double-check to make sure there isn’t a window hiding somewhere that is waiting for your input.
- QGIS does not automatically close windows after it runs a process. If you aren’t sure if something has happened, take a look at your map and your list of data layers.
- If your map is blank, make sure you are zoomed to the layer (more on this below).
Instructions
1. Download QGIS if you have not already and download the zipped data files for this tutorial. Unzip them and move them to wherever you would like on your computer.
2. Open QGIS.
3. Click to open the Data Source Manager to load data.
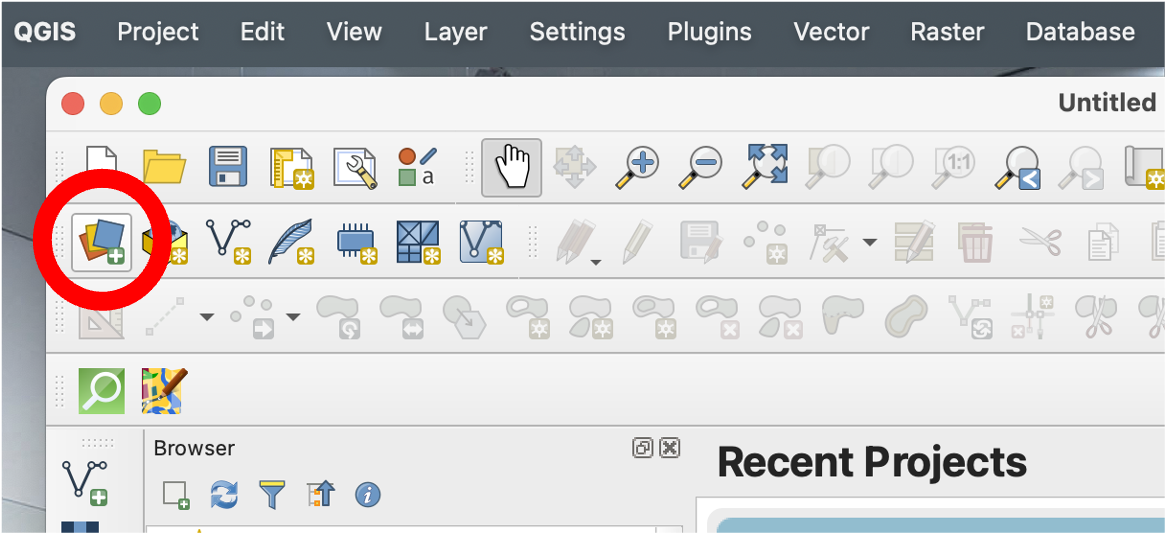 This will let you load all types of data, but you need to be sure you are selecting the right type for your file. We will load in the Portland boundary map, which contains vector files, so ensure that you have "Vector" selected in the left panel.
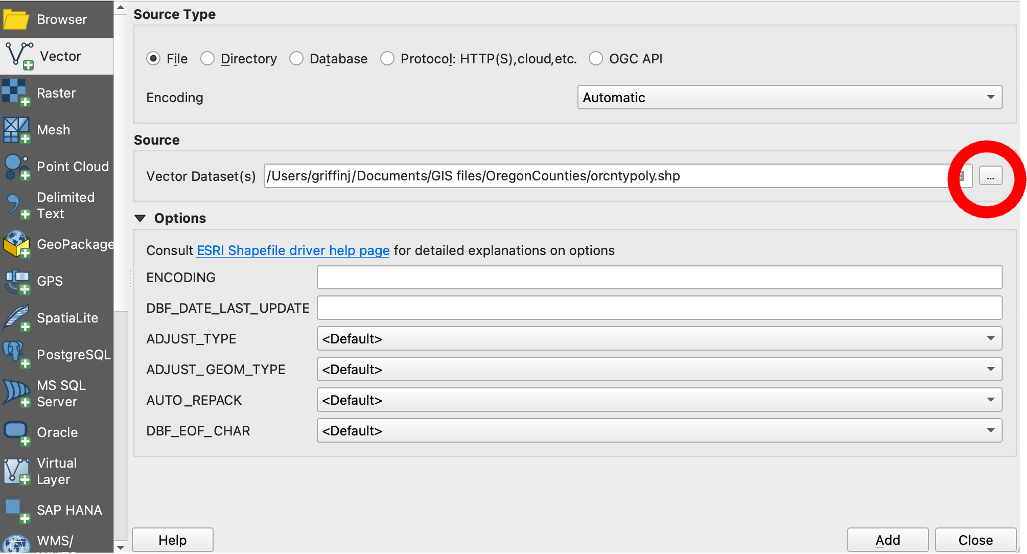
4. Next click the three dots next to Source: Vector Datasets and in the pdx_boundary folder select the pdx_proper.shp file from the counties folder. Leave everything else as is and click Add. Once you press Add once, the file is added, but you may not be able to see that right away. Press Close and you should see the new layer. (If a box pops up asking you about CRS Transformations, just say OK.)
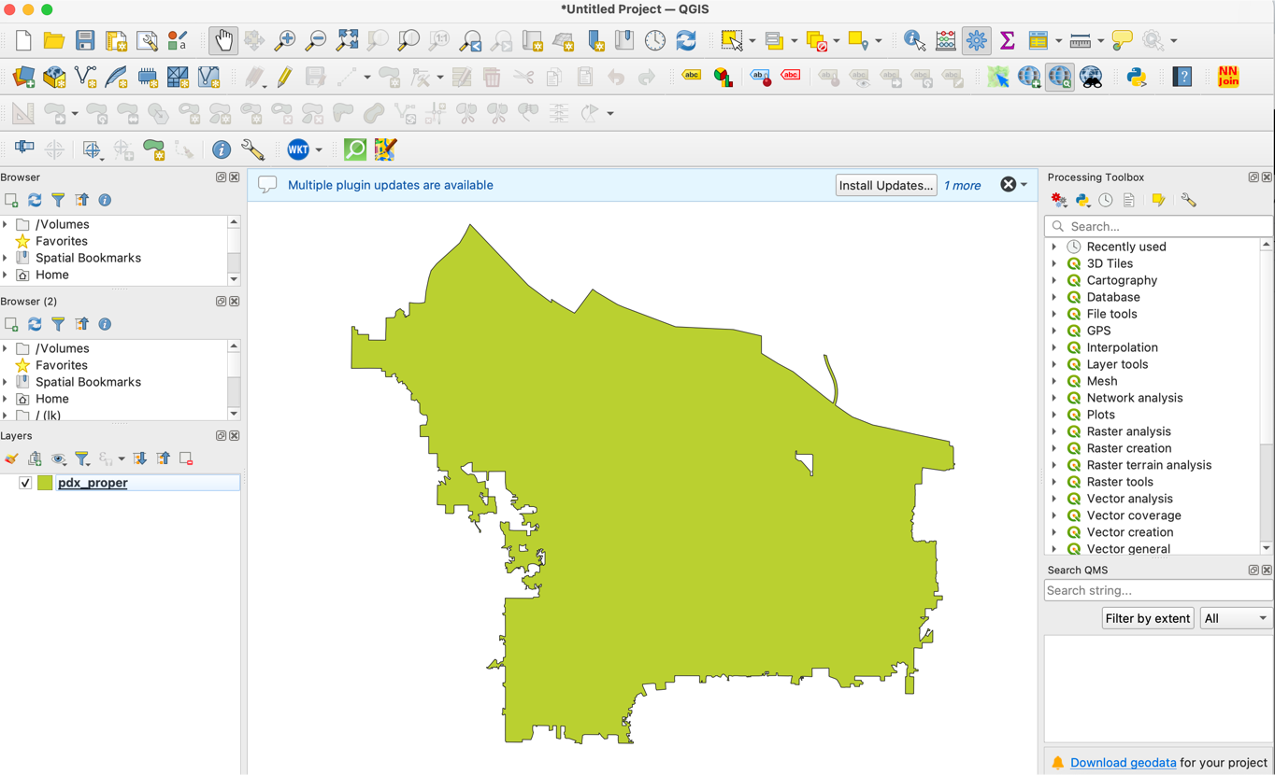
You should see something that looks similar to the following picture. The color may be different. QGIS automatically picks a random color for any files added. You can change the color later. This file has loaded in as a layer. Every layer is displayed on the bottom right panel. If a layer is checked it is visible, if not it is hidden. Layers are shown in order they appear.
5. Next we will add a road map for all of Oregon. It is also a vector file, so the procedure is the same. Click the Data Source Manager, ensure you are in Vector files on the left, click the three dots and add the roads.shp file. (Again, if a box pops up asking you about CRS Transformations, just say OK.) You should see a map similar to the following:
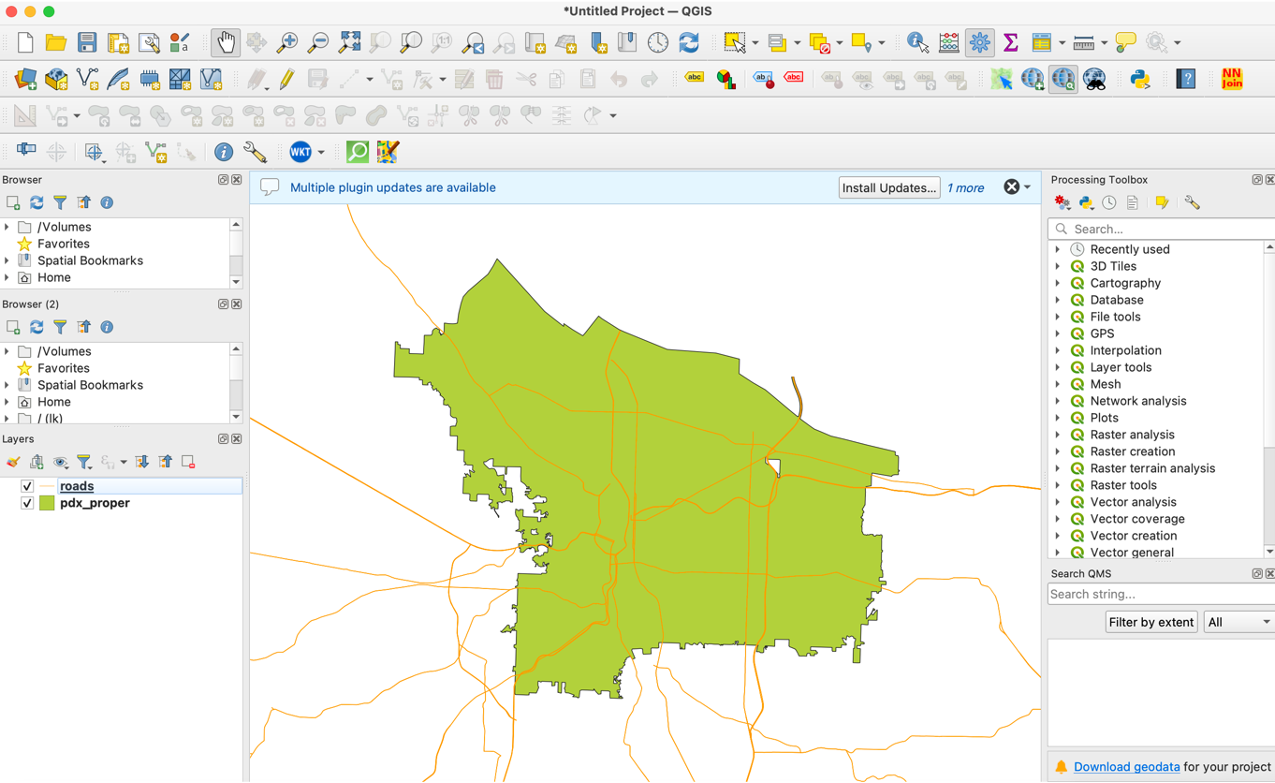
Notice on the lower left there is a new layer called roads. You can zoom in and out to view the layers in more detail using your touch pad. If you ever find yourself way off the map, you can right click a layer in the left panel, like the word roads, and click Zoom to Layer(s) to return to the map.
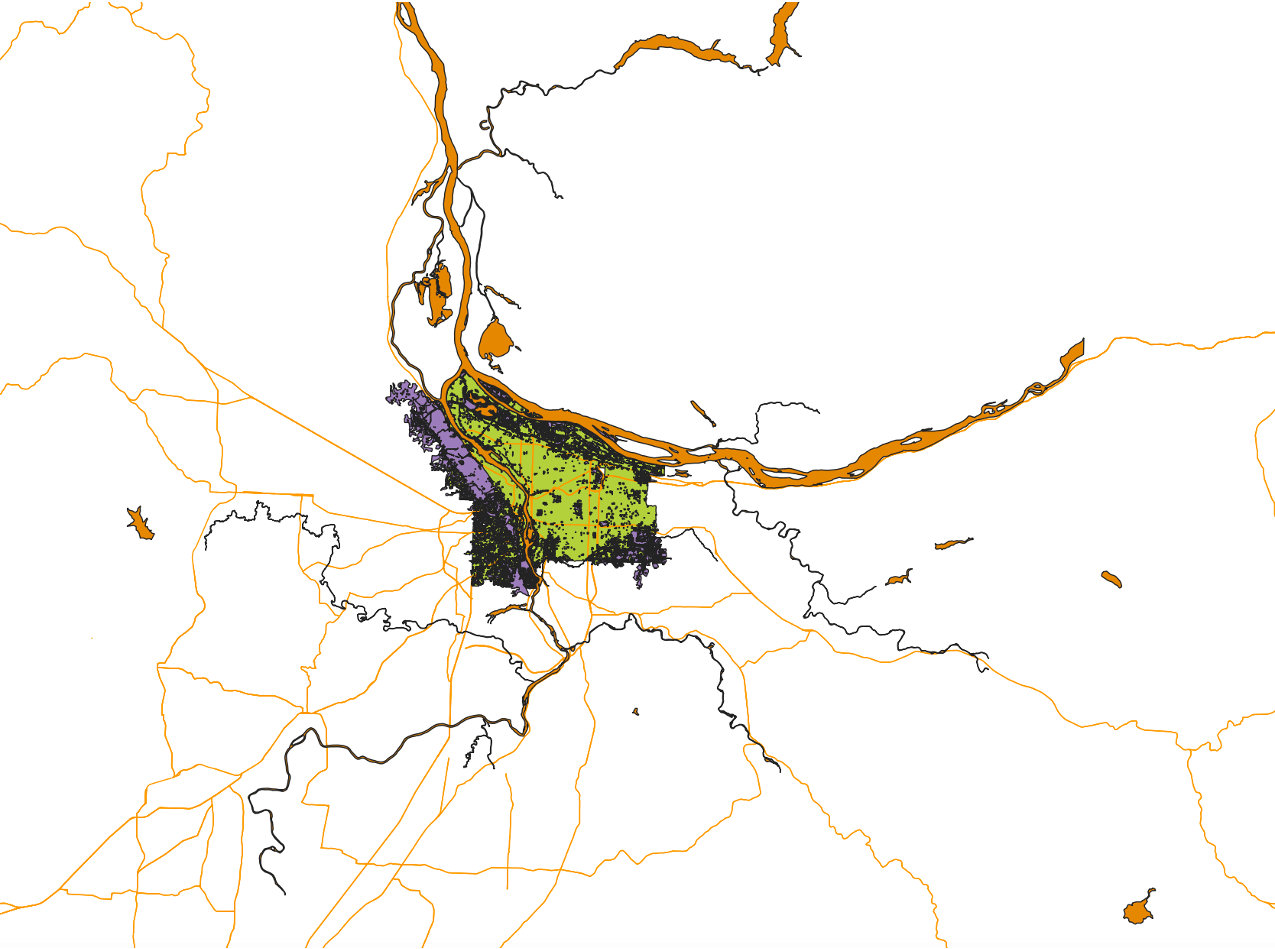
7. Now let's add the two more .shp files from the data you downloaded. They are also a vector file, so repeat the steps above to add the Vegetation.shp file and the riv_fill.shp file. When this file is added, you should be able to see an overlay of vegetation in the Portland area and river boundaries. Click Zoom to Layer(s) on the river layer. Your map should look like the following map, which is pretty ugly and difficult to get information from. Continue the tutorials to learn how to improve this map.